Setup code coverage for VSTS and .NET Core.
Let’s imagine that you have VSTS build pipeline for continuously build and test you project. Moreover your project can also has many (or not) tests. To understand what places in your code are covered and what not, you might want to gather coverage code coverage statistic for your tests. Let’s take a look how we can do this using out-of-box solution in VSTS.
First of all there are a few changes that need to be done before:
- Add
Microsoft.CodeCoveragepackage reference to your test projects (this step is not required if the package is bundled into the dotnet SDK); - Add
<DebugType>Full</DebugType>to each of project in the solution.
The option <DebugType>Full</DebugType> is required to emit a classic windows PDB symbols instead of symbols in portalble format (<DebugType>Portable</DebugType>). This is a temporary workaround for .NET Core. See issue.
After steps above, you can run code coverage in two ways:
- using .NET Core SDK (through
dotnet test); - using Visual Studio’s component called
vstest.console.exe.
Both of this commands correctly works only on Windows and require Visual Studio Enterprise to be installed :( See the following issue. And according to that RFC, support for Linux and Mac will not be in the near future.
So, let’s consider code coverage through vstest.console.exe tool in scope of VSTS test task.
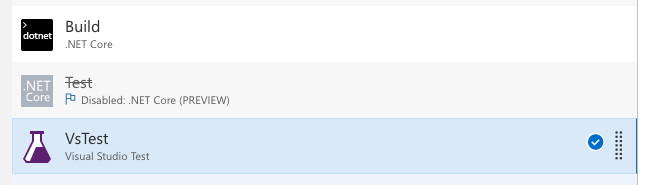
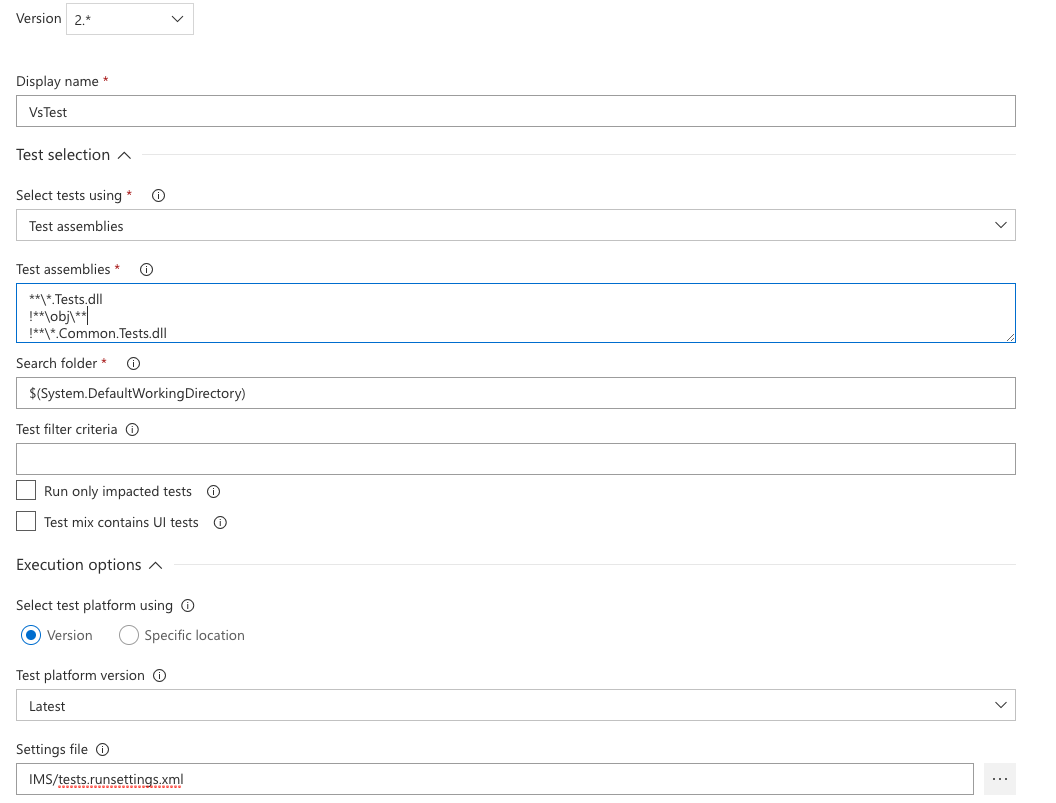
Here is a basic configuration for Visual Studio Test task:
| Setting Name | Value |
|---|---|
| Select tests using | Test assemblies |
| Test assemblies | **\*.Tests.dll |
| Search folder | $(System.DefaultWorkingDirectory) |
| Settings file | tests.runsettings.xml |
| Code coverage enabled | true |
Important: It is important to specify the scope for code coverage, because by default the tool calculates coverage result across all existing assemblies in the output directory. As a result coverage result might be less that it is.
You can specify coverage scope through *.runsettings.xml file like in example below:
<?xml version="1.0" encoding="UTF-8"?>
<RunSettings>
  <DataCollectionRunSettings>
    <DataCollectors>
      <DataCollector friendlyName="Code Coverage" uri="datacollector://Microsoft/CodeCoverage/2.0">
        <Configuration>
          <CodeCoverage>
            <ModulePaths>
              <Include>
                <ModulePath>.*ims.*\.dll$</ModulePath>
              </Include>
            </ModulePaths>
            <UseVerifiableInstrumentation>True</UseVerifiableInstrumentation>
            <AllowLowIntegrityProcesses>True</AllowLowIntegrityProcesses>
            <CollectFromChildProcesses>True</CollectFromChildProcesses>
            <CollectAspDotNet>False</CollectAspDotNet>
          </CodeCoverage>
        </Configuration>
      </DataCollector>
    </DataCollectors>
  </DataCollectionRunSettings>
</RunSettings>
The following section means that we want to include all assemblies containing ims section in the assembly name.
<Include>
    <ModulePath>.*ims.*\.dll$</ModulePath>
</Include>
If <Include> is empty, then code coverage processing includes all assemblies (.dll and .exe files) that are loaded and for which .pdb files can be found, except for items that match a clause in an
For further details you can go through documentation here.
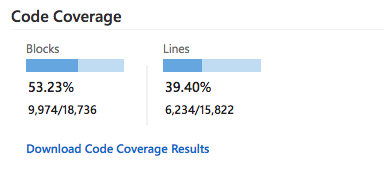
That’s it. Now it is possible to gather coverage statistics during tests execution. The result should looks like below: