WireMock case study: how to reduce delivery lead time
During the last half of the year, my team have done a lot in the context of automated acceptance testing for our services. The text below is an attempt to formalize what was done and what we’ve achieved as a team.
Context
The project where SOA (Service Oriented Architecture) is used and where Continuous Delivery approaches are gradually being introduced. All these require a very high frequency of releases and hence the ability for releasing and testing quickly and effectively.
A customer understands the need of having automated acceptance tests and ready to spend efforts for that.
There are a lot of development teams distributed across the world within the project. Experience in applying automated acceptance tests varies among the teams.
Problems
- Very high complexity of writing automatest acceptance tests. Especially for services with external dependencies.
- Existing tests are more like e2e (end-to-end). Hence tests become more clunky and fragile.
As a consequence we had:
- Lack of accepatce tests (automated and manual) for some services.
- Teams cannot or do not want to follow Continuous Delivery practices, as they are not confident on changes, because of a lack of regression testing. As a result, each release stretches over time, become big, making the probability of successful release very low.
Solutions
- Using WireMock for testing services in isolation.
- Creating dev-friendly tooling around WireMock, which drastically simplifies testing cross-service communication. Please let me know in the comments below if you want to know more about the tooling we’ve made.
Results
- Delivery lead time has decreased drastically.
- Time required for regression testing decreased
- Spotting bugs earlier before release to Production (shift left approach)
- High confidence when releasing something
The table may give understanding of how fast regression testing activities became (*):
| Name | Before | After |
|---|---|---|
| Service A | 40h | 2 min |
| Service B | 6h | 5 min |
| Service C | 25h | 1h |
(*) service names “obfuscated” because of NDA :)
The diagramm (CFD diagramm) below visually shows reduction of QA efforts when testing new functionality for any service.
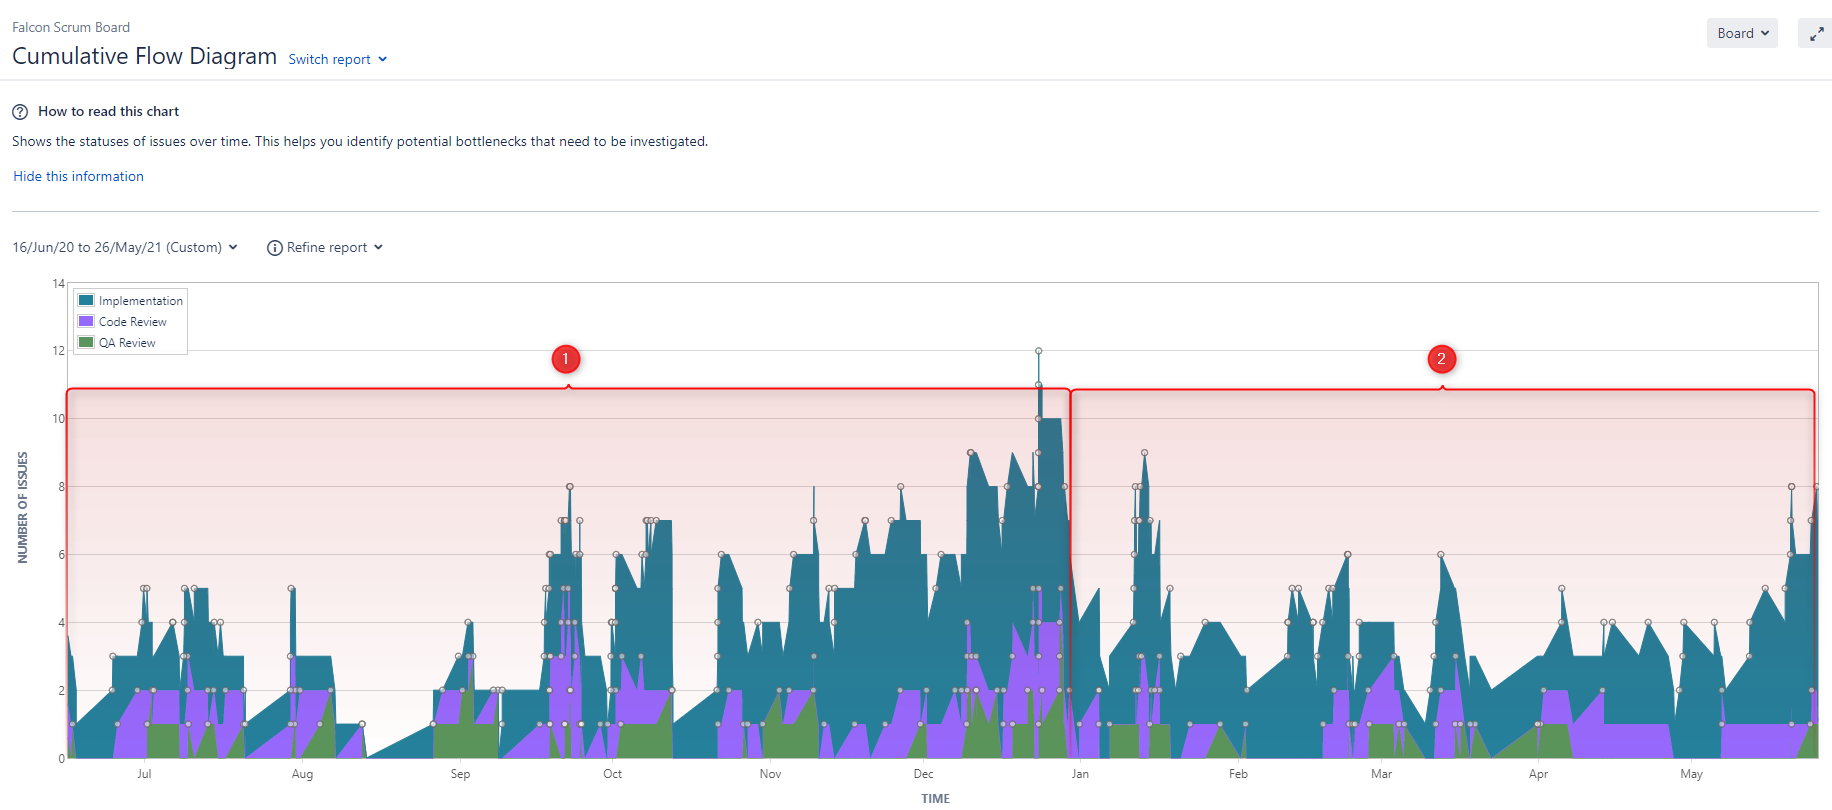
Legend:
- (1) - before applying WireMock
- (2) - after applying the tooling
The portion of QA efforts has been reduced. QA throughput increased by reducing the amount of manual testing.